

How to Identify Trading Opportunities
Lorem ipsum dolor sit amet, consectetur adipiscing elit. Proin cursus ligula ut convallis egestas. Maecenas non est nec ante cursus commodo. Phasellus in enim turpis.
Whether you are an experienced trader or not, you would need to practice the ability to identify the best trading opportunity.
Given a large number of instruments available on the trading platform, it is practically impossible to understand the market dynamics of all of them and stay abreast of the latest developments that could impact their price.
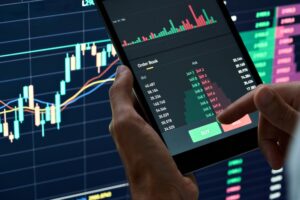
When you begin trading forex, stocks or any other instrument, price movements may seem sudden and unexpected. But that is not always the case! With technical analysis and the help of trading charts, you can cut out all the noise and focus on patterns in price movements.
How to Begin Using Charts to Identify Trading Opportunities?
Technical analysis helps you study historical price action in the forex and stock markets, to identify patterns and predict future price movements. The study of these charts revolves around recognising price trends to identify entry and exit points as well as support and resistance levels.
Before we begin with charts, it’s important for you to understand that the markets move in two ways. First is what is known as a trending market, where asset prices rise (also called an uptrend or bullish trend) or fall (called a downtrend or bearish trend). Second is ranging markets, where prices move within a specific range or sideways (neither up, nor down). One of the advantages of trading margin-leveraged derivatives is that you can find opportunities in either case, through a combination of the best technical indicators to determine patterns.
The markets may not be identical over periods of time, but some patterns do repeat themselves. Successful forex or stock trading is all about identifying patterns and entering trades when the odds are in your favour.
How to Analyse Charts
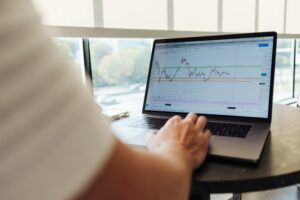
Let’s begin with understanding how to conduct price chart analysis, your primary tool for technical analysis. It is a visual representation of the asset price movement over a specific timeframe – such as 10 minutes, 1 hour, 4 hours, one day or one week.
Charts also show you changes in the demand and supply of an asset. They take into account every buy and sell transaction, every news or event, and traders’ expectations of future prices, at a given time.
Broadly speaking, there are three popular types of charts. The simplest one is a line chart, which has a single line connecting closing prices across the chosen timeframe. Then comes the bar chart, which shows open and closing prices as well as highs and lows for the day. The most popular chart is the candlestick chart, where the body of the candle shows open and close prices, while the wick shows high and low prices. The colour of candlesticks represents bullish and bearish sentiments.
Did you know?
Charts were drawn by hand in the early 20th century. Today, we have advanced trading platforms that provide easy-to-read charts.
Identifying and Trading Patterns
Here’s a description of some of the most common chart patterns you might use as a new trader.
Head and Shoulders (H&S) Pattern
H&S is one of the most common, reliable, and tradable patterns on forex trading charts and gives entry-level, stop loss and target profit points. It usually indicates a reversal in trends, bullish to bearish or vice versa. It can be used by all types of traders and across all timeframes.
There are three parts of the pattern, namely the peak (left shoulder), the higher peak (head), and the lower peak (right shoulder). A neckline connects the two highs or lows in the pattern, while the slope of the neckline can be down or up. The pattern is complete when the price breaks through this neckline.
The head and shoulders pattern can also be inverse.
If you want to learn how to trade the head and shoulders pattern, here are the four basic steps:
- A common entry point is the breakout point, where the price breaks through the neckline.
- In the market top pattern, stop loss can be placed just above the right shoulder, when the price breaks through the neckline. The head of the pattern can also serve as a stop level, but this is riskier.
- In the inverse pattern, stop loss can be placed below the right shoulder.
- Profit target is the difference between the low point on either shoulder or the head.
Not that so difficult right? Your demo account is a great place to practice and try out new strategies.
Key Fact
H&S cannot be traded before the completion of the pattern, and it may not always work. Sometimes, it can take months for the forex or stock price action to reach the ideal profit target, which means that you may need to use another indicator in combination with this.
Triangles Pattern
Triangles are commonly found in short timeframe forex charts, and they can be ascending, descending or symmetrical.
A descending triangle consists of a trend line that connects a series of lower highs and another line that connects a series of higher lows. It is a bearish chart pattern, where you can look for a price move below the lower trend line, as this indicates a build-up of downward momentum and an imminent breakout. Once this breakout occurs, this can be used for short-selling strategies.
To trade the descending triangle, there needs to be a high-volume downtrend. A short position can be entered from the lower trend line and the stop loss can be placed at the most recent swing high. Traditionally, the price target is the entry price minus the distance between the two trend lines when a breakout occurs. The upper trend line here can also serve as a stop loss level.
Key Fact
Forex or stock chart analysis needs to fit your trading style and lifestyle. For example, the number of hours per day that you can devote to studying charts will determine the indicators that are best suited for you.
Trading with Technical Indicators
Technical indicators can be used in price chart analysis to identify market trends and predict price action and reversals. Metrics like trading volume can show whether a trend will sustain, or a reversal may take place shortly.
There are many technical indicators, some best for day trading, others used commonly in swing or position trading. You need to find a few that can help you make informed trading decisions. Let’s look at some of the most popular technical indicators.
Moving Average Convergence Divergence (MACD)
This indicator can help you identify the trend direction and momentum, as it shows the relationship between two moving averages of an asset price. MACD is made of two lines, known as the MACD line and the signal line.
When the MACD line crosses the signal line from below, it indicates falling prices. When this happens, it may signal to open a short position. On the other hand, if the MACD line crosses from above, it indicates rising prices and a possible long position.
Here is an example of the indicator on the RAND to USD currency pair.
Relative Strength Index (RSI)
The RSI helps you identify overbought and oversold market conditions. If the indicator moves above 70, the asset is considered overbought, and you can expect the market to decline. If the RSI is below 30, the asset is considered oversold and there is a probability of the market moving higher.
RSI has another use on the price charts. If the indicator moves in the opposite direction to the price, it indicates that the momentum of the trend is weakening, and a reversal may be expected.
Bollinger Bands
You can get an idea of how volatile the market is with the help of Bollinger Bands. When the bands converge, it shows increased volatility, which typically presents more trading opportunities. When the bands move apart, it means that the market is experiencing reduced volatility and you may wish to exit your trade and look for opportunities in other markets.
Thing to Remember
It’s important to not crowd your charts with too many indicators, as this can be confusing and may even lead to contradictory signals.
It’s Not All in the Charts
As crucial as it is to use technical analysis to identify opportunities when trading forex and stocks, you cannot ignore the news and macroeconomic events. Sudden geopolitical events or unexpected fiscal announcements can cause sudden changes in prices. Economic releases from different countries follow a schedule and you can use an economic calendar to keep track of these events. If you want a rewarding trading experience, then a mix of technical and fundamental analysis in your trading is essential.

Make informed financial decisions.
Learn
What is technical analysis and how you should use it
The world is a volatile place right now and as a trader, you are looking for solid information to help…
Bytodorm
Commodities
5 Main factors that influence the Brent Oil price
Lorem ipsum dolor sit amet, consectetur adipiscing elit. Proin cursus ligula ut convallis egestas. Maecenas non est nec ante cursus…
Bytodorm
Learn
What is Short Trading?
Short and Long trading are two principal terms traders get to know while learning and applying their trades. When a…
ByKourken
Learn
What is Short Trading?
Short and Long trading are two principal terms traders get to know while learning and applying their trades. When a…
ByAnna Miller
Learn

How Do Interest Rates Affect the Market?
The world is a volatile place right now and as a trader, you are looking for solid information to help…
ByAnna Miller
Learn
What is a Stop Loss Order and Why You Should Use It
Successful traders are strategic traders and that means creating a trading plan and having the discipline to follow it. Your…
ByAnna Miller
Learn

The Effect of Recent Political Events on Oil, Gas, and Gold Prices
Lorem ipsum dolor sit amet, consectetur adipiscing elit. Proin cursus ligula ut convallis egestas. Maecenas non est nec ante cursus…
ByAdmin
Learn

A Step-by-Step Guide to Currencies Trading
Lorem ipsum dolor sit amet, consectetur adipiscing elit. Proin cursus ligula ut convallis egestas. Maecenas non est nec ante cursus…
ByAdmin
Learn

How to Identify Trading Opportunities
Lorem ipsum dolor sit amet, consectetur adipiscing elit. Proin cursus ligula ut convallis egestas. Maecenas non est nec ante cursus…
ByAdmin

